 Blog 2 – PA 510 January 18th, 2011
This second class was devoted to laying the foundation for the examination of Smart Grid. Conrad Eustis provided a primer on electricity and the basic infrastructure of a “dumb” electric grid. Jeff started to lay out the history of energy policy. Some time was spent on class communications logistics, the course textbook (Smart Power by Peter Fox-Penner), and the small group learning exercise. This blog will not concern itself with logistics or the small group learning exercise, but will focus instead on the substantive lectures focused on the Smart Grid, and partially on the readings for that week.
Grid 101:

 Conrad Eustis led of the class by presenting what he calls “Grid 101”, beginning with the basics of how electricity works. Starting at the most basic level, he explained that electricity is the flow of electrons along a conductor such as a wire. The rate at which the electrons move is measured in amperes, or “amps”. But as we all know homes are equipped with sockets that provide both 120 and 240 volts of power. How does voltage relate to amps?
Voltage measures the charge inherent in the flow of electrons. This would be similar to the water pressure in a pipe held at various angles. A flat pipe has no ability to exert power, whereas a pipe held at a 45° has some pressure, and a vertical pipe has the greatest pressure. The voltage refers to the “pressure” driving the electrons and their commensurate ability to do work.
Thus the power that an electrical charge exerts (expressed in watts) is a combination of the voltage and the rate of flow (amps). However, as we know most voltages are fixed (for example 120 or 240 for households) thus watts are proportional to the current flow (amps). For example:
- A 1,200 watt hair dryer consumes 10 amps of flow on a 120 voltage line.
- A 5,520 watt clothes dryer consumes the flow of 23 amps with a 240 voltage line.
By definition a 100-watt appliance uses 100 watts in an hour, or 100 Wh, or 0.1kWh (zero point one kilowatt hours). Kilowatts per hour, “kWh”, is the comprehensive unit of measurement for energy consumption since it combines amps, voltage and time.
Now we get to another important distinction: the difference between energy and power.
The 1st Law of Thermodynamics states that energy simply exists; it can neither be created nor destroyed. The 2nd Law of Thermodynamics states that energy can be transformed from one from to another. It can be harnessed to enable work. “Power” is the rate at which we use that harnessed energy.
In the electric industry “capacity” and “demand” are also used instead of “power”. For people in the electric industry power is also an attribute of the electrical delivery system or power conversion unit. In other words they consider that their delivery infrastructure, and/or specific devices are designed or rated to accommodate specific amounts of energy. Applying too much energy reduces efficiency and increases the amount of energy lost through heat diffusion. When efficiently consumed, energy creates value (e.g., 1000 kCal/day, about 4 oz of fat, (~50 watts) keeps an adult warm).
The 2nd law of thermodynamics also states that no transformation is 100% efficient. When energy is transformed some of it leaves the system, often in the form of ambient heat. Another way to say this is that Energy flows from an organized state to a disorganized state, from high availability to low availability. This is referred to as entropy. But not all systems experience a net exodus of energy. An “anti-entropic” system benefits from external energy sources that replenish and increase the amount of available energy. Thus Earth benefits from 174 billion MW of solar energy that radiates into our system every day. Most systems and living organisms progress from an anti-entropic state, to a state of equilibrium, and finally to an entropic state until all energy has escaped and the system ceases to exist.
Such a digression into the Law of Entropy (2nd law of thermodynamics) is probably more relevant to a broader discussion of sustainability, but for now we are primarily concerned with the transformation of energy into power and the delivery of that power across the country to the end-users.
As Conrad stated before, to produce power we must transform energy into a form that can be harnessed. We can use kinetic energy, chemical energy, nuclear, potential, solar, wind, wave and geothermal energy, but for the purpose of supplying the grid we will need to produce a steady stream of electrical power. The generation plants are typically rated by the amount of energy that they can produce in a single day. So a 1 MW plant that operates all year produces 8,760,000 kWh. Yet if that same plant only operates for 4 hours every year it produces only 4,000 kWh. Since these plants have a high fixed cost it is desirous to run them continuously.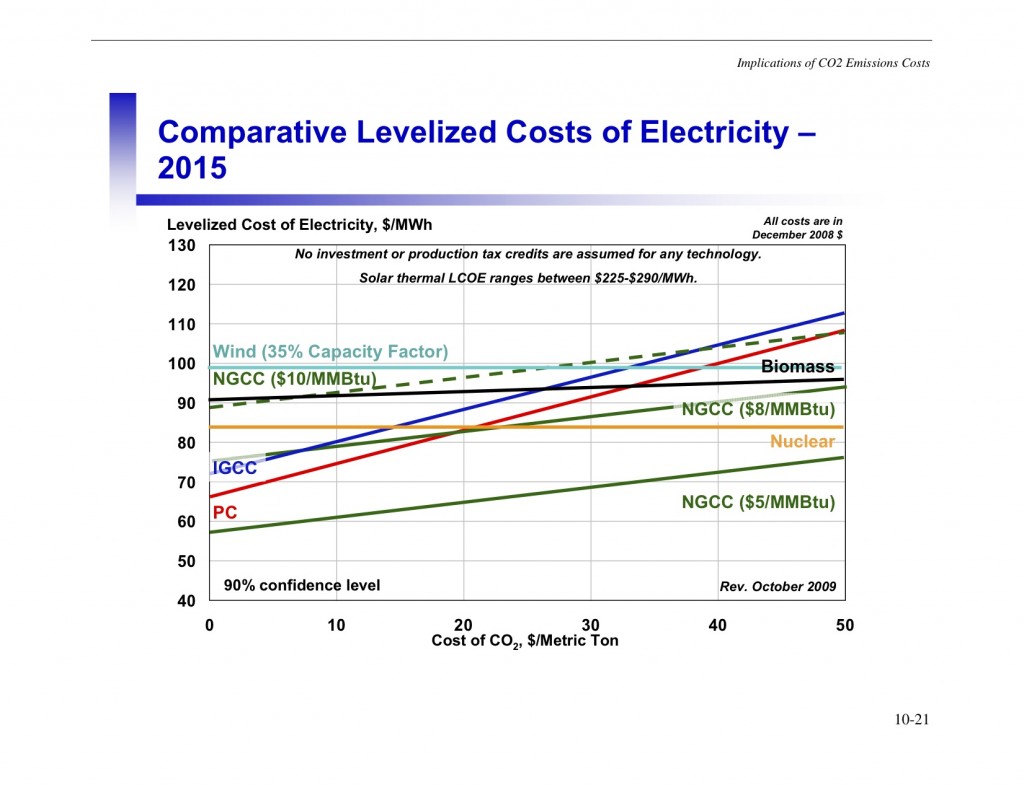 Note that the levelized cost of the renewable energy sources is significantly higher than the fossil fuel energy sources, with wind estimated to cost $.10/kWh and biomass coming in at $.095-.099/kWh. Of particular interest was the slide that Conrad presented that showed the costs of new power plants. Note the rising cost of the pulverized coal (PC) and the integrated coal gasification combined cycle (IGCC) plants, as the cost of carbon emissions rises. The carbon cost of the natural gas combine cycle (NGCC) turbines also rises, but because their carbon footprint is less the increase is not as dramatic.
Conrad now provided a brief overview on PGE:
![]() Operating in 52 Oregon cities, Portland General Electric Company serves approximately 816,000 customers, including nearly 100,000 commercial customers. PGE has a diverse mix of generating resources that includes hydropower, coal and gas combustion, wind and solar, as well as key transmission resources. Their 13 power plants have a total combined generating capacity of 2,434 megawatts.
Operating in 52 Oregon cities, Portland General Electric Company serves approximately 816,000 customers, including nearly 100,000 commercial customers. PGE has a diverse mix of generating resources that includes hydropower, coal and gas combustion, wind and solar, as well as key transmission resources. Their 13 power plants have a total combined generating capacity of 2,434 megawatts.
PGE began back in 1889, when a generator at Willamette Falls in Oregon City produced power to light 55 street lamps 14 miles away in Portland — the first long-distance transmission line in the nation.
Key facts:
· Service Area 4,000 Sq Miles
· Population Served 1.6 Million
· Serves 710,000 Residential Customers
· Average Residential use 11,000 kWh (1.25 kWa)
· 100,000 Commercial and Industrial
· Total Sales 20 Billion kWh
· Annual Revenue about $1.7 Billion
· 825,000 Meters, 180,000 Street Lights
· 4,000 MW Peak Demand (winter & summer)
o In winter 2,100 MW from Residential average 3 kW
o Each service drop supports 24 to 48 kW
Discussion of Grid Infrastructure:
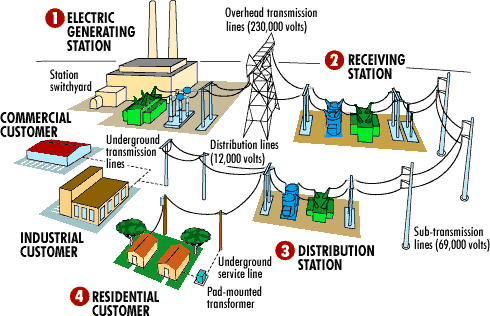 The balance of Conrad’s presentation was a detailed explanation of the generation, transmission and distribution system that makes up today’s “dumb” grid. According to Conrad, PGE produces about 1/200th of the nation’s electric energy.
PGE is a vertically integrated utility owning both the generation, the transmission and distribution facilities. It is not self sufficient in power and depends upon long-term contracts and purchases on the spot market to fill in the additional demand. PGE typically has higher household usage rates because of the demand for heating and cooling – so they are both winter and summer “peaking”. PGE owns most of its own transmission and distribution equipment except where it uses BPA substations and lines.
A giant ring of bulk substations surrounds Portland and Vancouver so that power delivery is redundantly supplied – power can circle to the customer in either direction. This ring consists of 10 Bulk Power Substations that create 115 KV Transmission Feeds to about 90 Distribution Substations.
The local transmission and distribution infrastructure is made up of:
• 1,600 Miles of Transmission
• 12 Bulk Power Substations
• 158 Distribution Substations
• 260 Distribution Transformers (Transmission to 13kV)
• 585 Feeders, about 18 Switches per feeder
• 220,000 Power Poles Owned; Rent on 43,000 Poles
• 15,500 miles of Primary Voltage distribution Circuits (half underground)
• 190,000 Utilization Transformers (e.g. 7.6 kV to 240 V)

“We actually had these great ads where the wires turned into snakes. It was very effective, but some people complained that they were too scary. So we don’t do that anymore…”
The book value (what was originally paid for it) of all this hardware is between $3 – 4 billion, but after depreciation it’s only about $1 billion. But to replace it today would cost closer to $10 billion. All of this equipment must be mapped out and tracked to ensure timely maintenance and effective system repair.
What followed was a pictorial guide to the transmission and distribution system featuring enough poles and wires to satisfy any linesman’s nightmares. But without delving into the details of all the pole configurations to be found, the following key observations should be noted:
• To move electricity over greater distances it is more efficient to do so at a higher voltage. But requires that the power be “stepped down” as it is distributed to customers and households. Using higher voltages decreases line loss, which is often estimated at 9-10%.
• The DC intertie transmission lines moving power across the region (from BC to California) covering as much as 865 miles typically carry voltages of 500 kV – these are not part of PGE equipment, but belong to the BPA.
 • The AC transmission lines that carry the power from 50 to 500 miles into the bulk power substations at voltages of 500kV and 230kV serve the next biggest transmission requirements.
• From the bulk power substations to the distribution substations the lines “transmit” 110 KV, or in older areas 57 KV.
• At the local distribution substation the power is then “transformed from 110 KV to primary voltage of 7,200 in our system.
• Finally, the power is routed via feeder lines to 2,000 – 3,000 customers. At PGE these feeder lines typically carry 7,200 volts in order to reduce line loss, and each feeder has a breaker. “One wire to ground is 7,200 volts; phase to phase (there are three phases) are 13,000 volts.” At regular intervals “service drops” connect to individual customers.
• Feeders:
o Typical Voltages 25 kV, 13kV, 4kV
o Starts with Breaker at Substation
o Serves One Lg. Industrial or 500 to 6000 residential
• Service Drops:
o A few Large Industrial Customers at Transmission Voltage e.g 110,000 volts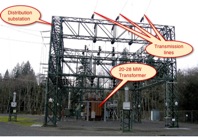
o Several Hundred at Primary Voltage 13,000 volts
o Most At Secondary Voltage Via Utilization Transformer that Serves 1 to 12 customers
o Secondary Service Drop Distinctions
o Number of Phases 1, 2, or 3
o Wye or Delta Wiring
o Voltage 480, 277, 240, 208, or 120
• The system is designed to accommodate power going in one direction, which poses a problem for the smart grid, which envisions two-way communication.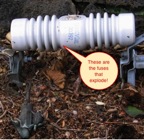
Transmission and Distribution points to remember:
• System Design for Power Flow in 1 Direction
• When a Wire Breaks you still need to roll a crew to fix it
• Protection Device Designed to Protect Wires and Transformers. Every fuse is an engineering design task.
After a break the class reviewed the mechanics of Small Group Learning, and the formation of said small groups. They subsequently met after class to assign roles and adopt norms.
Jeff began his “History of Energy Policy and its Implications for the Smart Grid”, but was soon cut-off by the end of class. His presentation will be included in the next blog.

Woah this site is fantastic everyone loves looking at the articles you write. Remain up the terrific do the job! You know, most people are seeking about because of this information and facts, you could possibly aid all of them greatly.