Smart Grid Blog 6 – February 14, 2011
– Conrad Eustis
This lecture is a continuation of Conrad’s prior lecture in which he outlined how the existing Grid worked. In this presentation he poses the question, “What are the benefits that we derive from the Smart Grid?”
Here are some of the more obvious benefits that accrue from the Smart Grid:
1. Increased energy efficiency
2. The ability to integrate variable energy from renewable sources
3. Improved asset utilization
4. Carbon reductions, by virtue of the increase renewables and less line loss
5. And finally a more reliable grid with fewer outages, etc.
Increased energy efficiency:
But aside from some cost savings for the utility (no more meter readers) smart meters has no inherent benefits – all by itself. Some people refer to smart metering as the “foundation” or prerequisite for AMI (Advanced Metering Infrastructure). What does this mean?
It means that for the next generation grid to function more efficiently it can no longer be deaf and dumb; it will need to communicate information multilaterally across the grid. And for that we need to develop a standard for passing data between the discrete elements of the evolving grid. It will need to provide the interactivity that will empower 3rd party aggregators and integrators to optimize the utilization of assets and multiple energy streams.
And that means knowing a lot more about the end-user. Therein lies the start of another major challenge to the evolution of the smart grid: privacy concerns.
Until now end-users have been oblivious of their energy usage and its pricing. But with the introduction of AMI (and variable pricing that it could enable) we have the opportunity to introduce the “invisible hand” – the curious concept that Adam Smith introduced in 1776 to explain the role of pricing in regulating demand and supply the marketplace.
PGE’s current implementation of AMI: PGE uses a “census” system that utilizes a tower-based approach which are fewer in number, but taller. They can aggregate 20,000 to 50,000 meters. Some utilities use a “mesh” network that runs collectors located on power poles or even meters to aggregate 1000 to 2000 meters. Most of the PGE meters talk to the tower using a licensed narrow band frequency. The data that is collected from this network, and others is collected in a meter data management system that allows you to collect and sort data for different applications. PGE is getting a web portal from Aclara that users will be able to gain access to their own data – using secure log in procedures.
PGE does have multiple AMI systems, including an industry standard MB 90 system, some types of meters that they can read via telephone modem and even 2,000 dedicated units that were installed using SmartSync that communicate over dedicated “comm units”.
So now that we have the physical underpinnings of a smart grid in place that can provide detailed usage data. How can we use it since it’s pretty boring stuff on its own? How can we get the end-users to engage with this data?
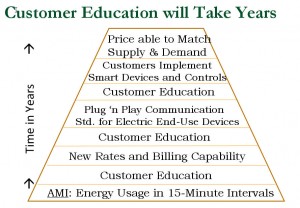 From Conrad’s perspective as a utility representative, initially the utilities will have to educate the consumer about the importance of the variable rates. The variable rates and Smart Grid do not guarantee that their bills will go down, but if they ignore the variable rates their bills will likely rise. He continued, “Then we’ll get smart appliances, but we’ll have to teach the consumers that even though the appliances are smarter it does not allow the utility to control their homes. Eventually, we should arrive at point of collective understanding where the consumer comes to understand both the rates and their ability to respond to them.”
“What does that accomplish”, asks Conrad? Customer education will take years to have most of their customer base to understand variable rates enough to be able to respond to them effectively. Consumers have never really had to be conscious of their energy usage, but with Smart Grid and variable rates they will become more responsive. PGE will use information to teach consumers about efficient energy usage. Customers are more likely to take “tips” from the utility.
Conrad’s opinion is that the real time energy monitors will have little impact after people look at them once and then forget about them. But a real time energy management system will have value once we have smart appliances.
Integrating Renewable Resources:
The real benefit of the Smart Grid, according to Conrad is in integrating the renewable energy resources. By 2025 we will have to integrate almost 2000 MW of wind energy that is highly unpredictable. In contrast all the preceding discussion about Demand Response was targeted at addressing an occasional capacity constraint amounting to about 800 MW. The ability to facilitate this integration of renewable energy will be a huge challenge, according to Conrad.
Improved asset Utilization:
Improved asset utilization is a goldmine. Most of the peak demand comes from residential appliances. Unless you can find an easy way to operate energy savings programs to address these efficiencies, you won’t get much traction. Conrad’s contribution to this problem has been to champion a standard interface for appliances. Theoretically, such an interface would provide a 10 to 1 benefit/cost ratio that will hugely improve the utility for the consumer and boost program adoption. Cites his study with Whirlpool and PNNL.
Now Conrad explained a load duration curve that shows how much additional power is needed for a short period. Utilities have peaking plants to meet only this high demand. If we can reduce peak demand we can reduce very expensive power.
Carbon reduction:
Conrad sees electricity as the most efficient form of energy. “Just look at history.” he says, “we started off burning wood. That was very inefficient. Then we turned to coal” … that allowed for hotter temperatures and more sophisticated applications, including the development of powered machinery that stoked the industrial revolution. Today we are moving through a period of natural gas use, but Conrad sees that only as a transitional step to a final phase in which we will be using electricity that is entirely produced by renewable energy.
More Reliable Grid:
This benefits gets a lot of attention. Outages do cost money. The question is who is going to pay for more reliability and who will want a discount for less reliability?
Conrad then supplied a rudimentary estimate of what it would cost to pay for the structural improvements that would enable self-healing and a more reliable grid.
- Automate Switches per feeder – $100 Million
- New Substation to allow alternative Feed – $50 mil
- Upgrade and new Feeder circuits – $20 million
- Engineering and Management Application – $50 mil
The total cost would be around $26 mil per year, or about $3 per Customer per month. This would reduce outages from 105 minutes per year to only 20 minutes annually. This increased cost cannot be justified if it is all applied to the customers, so we need to look for other cost savings that accrue from this investment.
Decreased line losses of about $5 million/year would apply. Improving the rural distribution network would bring in about $9.5 million/year.
Decreased overtime for line crews adds another half million, but in the end that only covers about 43% of the costs. So we really need a better business case to justify the cost of improving the reliability of the grid.
The Real Killer Reliability App:
The real “killer app” of in achieving more reliability is the home storage back up system. Customers would pay about $10/month. The Utility would pay for most of the cost and the maintenance so that the utility could use the batteries in a non-outage period (most of the time) in order to help integrate wind energy, supply peak demand and reduces line losses on peak. Battery costs need to come down to make this work, but lots of people are working on this.
Conrad also mentioned the PGE ARRA funded Battery project in Salem that has installed a 1,3000 kWH battery project.
In his concluding remarks, Conrad stressed that all these benefits depend in part upon much greater customer participation and that will take a long time to achieve.
________________________________________________________________________________________
 Smart Grid and Demand Side Management
– Jason Salmi Klotz, NEEA Senior Policy advisor
Previously worked with the CPUC on their AMI deployment. He also worked on demand response wholesale integration. He then joined the BPA to work on Smart Grid integration. Now he’s working for NEEA.
His focus for the presentation was:
- EE and the Smart Grid and DSM (Energy efficiency and Demand resonse and distributed generation).
- The California market has the potential to be the first of the Smart Grid because the way they’re creating their markets.
- Regulatory reality. And where the investment dollars are going.
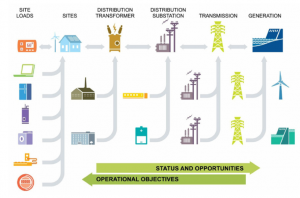
Energy Efficiency and the Smart Grid impact the whole spectrum – but mostly from transmission to site loads. Energy efficiency within the smart grid will be present on all these areas – from transmission to the consumer. We’ll have the IT overlay on almost all of these sectors and that will give us real time information which will cause a blurring of the distinctions between Demand Response and Energy Efficiency because we’ll have very active management of all our resources.
So we’ll have demand response on a real time basis, which makes it look a lot like energy efficiency resource because you’re constantly managing it and are at that most efficient point of energy efficiency. Now it’s beginning to look a lot like demand side management. Most of us think about energy efficiency as being close to the consumer and the appliances that they use, but you can energy efficiency in the distribution or transmission wires, transformers. In the case of industrial applications, any through put can be tweaked to achieve greater energy efficiency.
When you look at the Smart Grid from a high level it looks “oh, so lovely”, but once you get down to the details it gets very complicated. Jason then promised to give us some examples of just how complicated it can get.
A Nodal system:
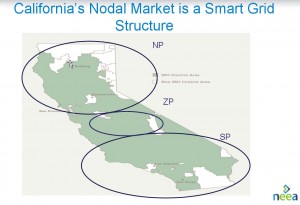
The first example is from a regulatory perspective, looking at what happened when California tried to integrate the main output of the Smart Grid, Demand Response into their new wholesale market system. The old system looked a lot like the Pacific Northwest: they had various balancing regions (NP, ZP, SP CA ISO). In the end everything had to be balanced so that the frequency was maintained and the grid didn’t crash.
In CA and New England, PJM and NY the pricing at the node, which can be equated to a substation. You can either inject power into a substation or pulling energy out of a substation. In California they’re going to start with about 300 nodes and work their way up to 3000 nodes. And each node will have real time pricing at 5-minute intervals. They become essentially their own little marketplace. Anyone taking energy from the node is subject to that price.
For example if your in San Francisco you have one major distribution line that brings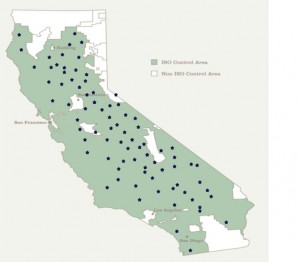 energy into the city and its congested; it’s over capacity and that makes the price go up. You have a lot of demand in San Francisco and that makes your prices go up. Even if the cost to generate the power is relatively low ($.05/kWh) in Sacramento by the time that energy reaches San Francisco the price has risen to $.15/kWh due to the distribution costs, congestion charges, constraints and demand.
At this point this transaction is going through one node, but in the future it could be several hundred nodes. The buyer and seller in this transaction are all at the CAISO (California independent system operator) level. The CAISO is the wholesale market in California. They have the demand and they have to find supply to match. Every energy transaction in California goes through the CAISO; every transaction has to be scheduled through the CAISO. Just because the nodal price in San Francisco is $.15/kWh doesn’t mean that the consumers will be paying that price. Currently PG&E levelizes the cost so that everyone pays approximately the same price. PG&E won’t be charging these rates in the immediate future, but maybe they might have to later. San Franciscans are worried about this new system because they see that in the future they may have to pay a much higher cost.
Jeff Hammarlund: So this is another example of the whether they charge a “postage stamp rates” or “railroad rates”. In the Pacific Northwest we had the same issue with regard to transmission rates.
FERC, who is the creator and regulator of these wholesale markets, has been forming markets since they issued Order 888 (www.ferc.gov/legal/maj-ord-reg/land-docs/order888.asp) in January 1998. They regulate the Independent System Operators (ISO) across the country.
Recently in 2007, they issued FERC Order 719, which required that all organized wholesale markets including:
- California ISO
- New England ISO
- New York ISO
- PJM – Pennsylvania, New Jersey and Maryland
- Midwest ISO
- (FERC does not regulate ERCOT in Texas, even though they are an ISO)
FERC Order 719 tries to introduce competition into the Wholesale markets:
With order 719 FERC instructed the Independent Systems Operators that they must allow Demand response to bid into the wholesale market. This was an important change, because until then all that existed in these markets was generation. This created the potential for a parallel, unregulated, demand response market especially in those less mature markets like the Midwest and California ISO’s.
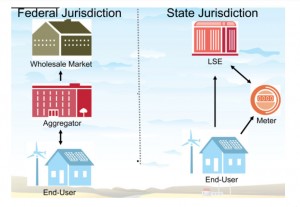
FERC only regulates large wholesale markets, which means that they controlled only the generation of power. However, consumers purchase their power from the utilities that are regulated by state Public Utility Commissions. And demand response exists mainly at the customer, or “retail’ level. With Order 719 the FERC has effectively mandated that all this “retail” DR must be included in the wholesale market. Many people have interpreted this a jurisdictional grab by the FERC.
No states have rules over how DR is to be treated, but with FERC Order 719 all this retail DR is moved into the wholesale markets and the FERC argues it has jurisdiction over all DR. As a result of Order 719, when you send DR into the wholesale markets the FERC rules apply. Otherwise the PUC’s have jurisdiction.
Ken Nichols: Effectively there is no difference between an energy generator and an aggregator of demand response – they can both be used to satisfy energy needs so it makes sense to trade them in this wholesale market. Jason Salmi Klotz: Theoretically you’re right but there are flaws with this approach…
As soon as you send demand response into the whole sale markets the FERC has jurisdiction. But at the retail level it remains under the purview of the states. But not every state is the same, not every state has AMI, not every state has laws to protect customers from aggregators that want to bid it into the wholesale market.
Aggregated Demand Market hinges on unregulated Third Party entities.
Unless this kind of response is aggregated by an LSE (“load serving entity”, any power provider that serves the customer, whether public or private such as PGE or EWEB), it is aggregated by a 3rd parties. They are also referred to as:
- CSP – curtailment service providers
- DRA – demand response aggregators
- DRP – demand response providers
These 3rd party aggregators go to electricity users (usually commercial or industrial consumers) and offer to manage their energy usage, including the application of some demand response elements. For example, they might go to a major retailer and adjust how their elevators run, how their HVAC system runs, how their refrigeration operates. The resulting demand response capacity is then sold (bid) into the market.
Order 719 perpetuates an Inefficient Demand Response market structure:
The third-party aggregated demand response is incentive, pay for play driven. The aggregators offer to pay their customers a portion of the demand response value, or they will pay the customers on a monthly basis. These payments often come in lump sums, which make it more difficult for state regulators to implement rate changes to encourage demand response because the customer is used to receiving money. Jason suggests that “it takes a pretty savvy customer to understand how (aggregators) are going to do that, when its done and how its going to affect customers.”
Unless aggregated by the LSE, demand response aggregation is generally done by Curtailment Service Providers. CSP’s (Curtailment service providers) are not directly, statutorily, regulated by either states or FERC. Most of the demand response megawatts bids into the East Coast are produced by CSP’s.
If, for example, you’re a CSR located in California where:
- there are millions of customers that all have smart meters
- that can be curtailed and
- their real-time information can be transmitted so that
- the ISO can make a settlement
- based on the aggregated demand response bid made by the aggregator…
Then you’ve got a potential moneymaker!
But today no state regulator has control over this process. Jason’s point here is that the FERC’s bid to move the aggregated DR into the wholesale markets depends upon unregulated third parties.
How do CSR’s work?
They use a series of baseline assessments to determine how much energy you curtailed. They will take average usage and daily usage to make a series of regressive analyses to which they apply rigorous measurement and verifications standards. In California they look at the 10 previous days. All the ISO’s have a process for doing this, but they all have different rules about the measurement and verification. This is part of what NIST is trying to resolve with standardized protocols.
Order 719 perpetuates an Inefficient DR market structure:
On the wholesales market side you need to have high enough retail rates to incentivize the CSP’s/aggregators to bid into the market place. The CSP’s contract directly to PG&E, or SDG&E, or SCE to supply the Demand Response to the LSE (PG&E, or SDG&E, or SCE ) who can then take the DR to market, to the ISO and receive some sort of settlement. Or the LSE can offset this avoided demand with generation that they would have purchased in the market.
On his slide covering this aspect of the market, Jason points out “resale of demand implies that surplus exists in the marketplace”. He suggests this an inherent weakness. I’m not sure I understand this distinction.
Jason makes the case that from the perspective of the LSE’s – most non-decoupled entities would rather run demand response programs involving bid and settlement of retail demand than offer dynamic rates which reflect wholesale conditions. Why is this?
Programs require staffing, support structures, front and back office activities which can all be collected through the rate base, thereby allowing the IOU to collect more than if dynamic rates where in place.
But the FERC wants to cut out the LSE’s role; they want the CSP to send the DR right into the wholesale market – to trade it as negawatts. This creates some problems.
CSP’s wishing to submit bids into the wholesale market must supply detailed information to the market, the LSE and the customers.
Including:
- Customer’s energy supplier
- Electric distribution company
- Pricing zone
- Dispatch contact information
- PNODE
- Retail rate
- Metering requirements
Despite these onerous information requirements this model has already experienced some difficulties.
- In 2006 PJM suspected baseline gaming by demand response providers
- In 2008 California had to amend aggregator contracts out of poor performance concerns. Aggregators were being paid for capacity that was never shown to exist.
In Jason’s opinion, the lack of regulatory oversight over the aggregator market is a significant weakness in the FERC model. He uses California as an example and urges us to consider that the state currently allows aggregators to operate within the state, but state regulator’s oversight of this market is only indirect (through the IOU’s with whom the CSP’s have a contractual relationship). Despite the fact that no law prevents the CSP’s from bidding aggregated demand directly into the wholesale market, all aggregator DR is being sold exclusively to IOU’s. At the retail level the lack of oversight and regulation is even more ominous. Despite the complexity of the DR program obligations and their potential value for CSP’s – there are no rules governing the interactions between the CSP’s and their retail customers. This is a time bomb waiting to explode.
Scheduling issues arising under the proposed FERC market model
Another problem that arises under the proposed FERC market model is that it can create scheduling conflicts that could cause utilities to generate the very energy they just agreed to sell through a demand response program.
In the wholesale markets everything has to be scheduled and settled on a real time basis. Each of these wholesale markets has several different markets:
- 5 minute market,
- 10 minute market,
- 30 minute market (sometimes),
- 1 hour market,
- “Day of” market and
- “Day ahead” market.
In each of these markets you have generators providing an energy supply and load serving entities meeting the demand for energy. And each of these markets has to be balanced between supply and demand. That’s only two entities and it’s still really complicated. Now with the FERC proposal you are introducing another entity: the Curtailment Service Provider (CSP). The CSP is going to take some of this demand and bid it back into the marketplace.
Wholesale markets operate using gatekeepers, in this case they’re called “scheduling coordinators”. The scheduling coordinators act on behalf of the IOU’s, or the LSE’s and the generators. But the problem that has been happening in New England and California is that the CSP’s don’t use the same scheduling coordinators as the load serving entities in the regions that they’re operating in. So LSE’s like Pacific Gas & Electric don’t always use the same scheduling coordinators as the CSP’s the scheduling coordinators aren’t talking to each other. So it’s possible that they could buy demand for customers that don’t need it because they just curtailed it. The complexity of the bid and settlement process in the proposed FERC model has unintended consequences that create market inefficiencies.
Currently the California ISO is supposed to be the coordinating entity, but no rule requires them to do that in real time, which could prevent anyone from gaming the market. This is another example of the uneven regulatory coverage that exists and its inadequacy for providing effective oversight over the proposed FERC market model for Demand Response. FERC’s Order 719 is pushing the LSE’s to make room for CSP’s. This effort also represents almost $2 billion in investments to create this new market.
This Business Model Places the AMI Enabled Consumer in Jeopardy
Consider that by 2012 California will be the first state to have all retail customers enabled with AMI.
• Each customer will have sub-hourly metering data, which enables CSPs with enough information to meet measurement and verification requirements for sale of DR at the wholesale level.
• CSPs will be able to sign contracts with end-users, even residential customers, for curtailments.
Most residential customers are not energy or business savvy enough to understand the implications of contractual relationships for demand response. And yet there is no regulatory oversight over this important market.
The Efficient market: Dynamic rates
Jason suggests that a more efficient approach would rely on dynamic pricing that permits customers to choose whether to incur costs or lower demand. It would apply downward pressure on the wholesale market prices without additional bid and settlement requirements. He goes on to suggest that the LMP (locational marginal pricing) and nodal markets that the FERC and the ISO/RTO’s set up operate efficiently to charge proper market prices for delivered energy. In Jason’s opinion this model could be pushed down into the retail level to encourage demand response.
How much is the sleeve off your vest worth?
CAISO, NEISO, PJM and MISO all claim more than 2000 MW of DSM in their markets, yet back-up generators supply most of it in MISO and the eastern markets. This begs the question of how real this Demand Side Management really is. In CAISO 2100 MW of their 2500 MW of DR is comprised of emergency DR that is available only a few times a year and was used 5 times in the last 6 years. In reality only 400 MW is capable of dispatchable responsiveness in California.
What are the DR prospects for the Pacific Northwest?
The key questions to answer this questions concern the availability of money to invest in DSM and the Smart Grid. Will the regulators fund the smart grid in the Pacific Northwest? And if they do, what is the optimal investment model for the region?
The role of energy efficiency in supporting the Smart Grid:
Finally, will energy efficiency drive the smart grid investments, or will it be the other way around?
Energy efficiency is the most mature Smart Grid resource we have in the Pacific Northwest. Energy efficiency investments have risen from 1-2% to 4-5% on average across the region. Both NEEA and the BPA have been working to change the landscape for Energy efficiency appliances, technology and market transformation.
However, energy efficiency receives the most scrutiny from the regulators for every dollar spent. Recent efforts to get approval for Smart Grid investments in the region have run into resistance. The following two proposals were recently denied:
- WUTC DOCKET UE-090704 PSE (2009) request for a 7.4% increase is denied. PSE begins deficit spending on EE programs.
- WUTC Avista Requested a 16.9% rate increase was told to return with a proposal for a 2.8% increase.
And increasingly DSM measures are being underfunded:
- PacifiCorp in Idaho is at a $3 million dollar budget deficit for its DSM measure in Idaho because the Commission has not approved proper recover in several years. PAC now proposes to cut back on DR expenditures in Idaho.
- IPC is operating a $17.5 Million dollar DSM deficit. Proposing an increased rider percentage increase to cover costs. IPUC has stated that may not allow IPUC to continue all DSM investments.
- NWE was recently allowed to propose a decoupling mechanism in Montana. However in approving decoupling the Commission lowered NWE rate on equity form 10.25% to 10%. (National average is 11%) This will cost the company roughly $1.5M per year of the decoupling mechanism. And now the new commission is investigating their own prior approval of the de-coupling!
What’s the current state of the Smart Grid in the Pacific Northwest?
Coordination is key in the PNW but transparency is not ubiquitous.
- Many different balancing authorities
- Negative prices during wind events
- RPS continues to drive investment in wind, but we can’t balance it…
The BPA’s system is reaching capacity constraints, and there is no nodal model, nor congestion and constraint pricing. There is no mature real-time market for DSM resources to respond to.
Smart Grid in the PNW will be different than in the rest of the country.
To survive it may have to look like an energy efficiency investment. But here Jason sees significant regulatory investment skepticism.
DSM resources take significant time to create and dispatch correctly to address gird issues, and finally the ratepayer needs to be brought into the discussion.
________________________________________________________________________________________________
 Integrating Wind Generation on Northwest Power Grids
– Ken Dragoon, NWPCC
The Northwest Power Conservation Council was established by federal legislation to provide regional guidance on energy issues. The governors of the four Northwest states, Oregon, Washington, Idaho, and Montana appoint the Council members. The Council reviews regional power plan at least every five years and recommends funding for fish and wildlife programs to mitigate effects of hydropower development. It encourages broad public participation in regional energy issues. And it enjoys widespread credibility for its regional energy forecasts. They’re a multi-state compact – not federal agency.
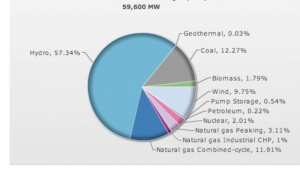
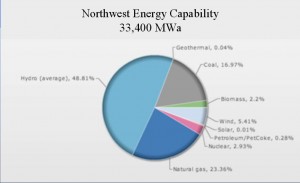
Pie chart of NW energy installed capacity: Hydro 57% – “name plate” capacity = the resources are technically rated to be able to deliver this capability, without other constraints. Wind 9.75%
We can’t get all the hydro potential. We can’t load those resources all the time, because there isn’t enough water to run it consistently. We get about 40% from the hydro resources. This graphic represents energy potential in the Pacific Northwest, excluding those portions of Montana on the eastern side of the Continental divide.
Also energy capacity of Hydro is 48%
Rapid growth of wind
Ken Dragoon’s talk focused mainly on wind since he sees it as “motivating a lot … of activities in Smart Grid”. Show historical development since 1998. There has been a tremendous expansion in wind projects between 1998 and January 2011. He also discusses the solar projects and wave energy projects.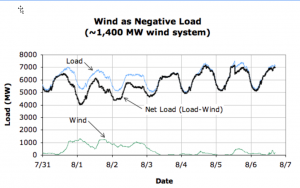
NW wind resources (name plate capacity) now tops 5,000 MW with another 2,000 MW under construction. This is a big change that has come to the PNW.
How and why is this happening?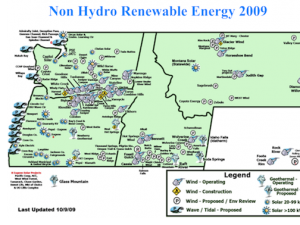
– $20/mWh production tax credit for the first ten years of production – when economy crashed it was changed to an investment tax credit and later into a grant program.
– The states have renewable energy targets:
o Montana, Washington and Oregon have an RPS
o Idaho is lagging.
– State Tax credits and incentives:
o Oregon has the Business Energy Tax Credit (BETC)
o Washington has a sales tax exemption
o Montana has a sales tax exemption.
Ken was recently in China and discovered that they were accelerating their investments in renewable energy resources. China announces that they will get 1% of their energy from renewables by 2020. They are now #1 in wind installation. They cite climate change as the reason.
PNW has been growing by leaps and bounds. DOE did a study to see if we could hit 20% by 2030 – that would mean a 4 x increase. This is a big change. 5,000 MW of wind in the PNW now – Montana is 3rd to 5th place in terms of available wind resources. And it’s almost entirely untapped.
Wind poses challenges such as problems of accommodating the excess energy events. This is a variable resource and it’s hard to predict. We may know when a storm is coming in, but not exactly at what hour, so we could miss the event by as much as 3 hours and this is a huge amount in terms of scheduling.
They do have a reasonable notion of what will happen the next day, but not always what will occur on the next hour. In order to deal with this variability the energy system operators retain a generation reserve that is ready and willing to come up, or be turned off at a moment’s notice. This is not an entirely new problem, but with the amount of wind hitting the system now, it represents more events happening with greater volatility. Initially there had been a great deal of concern about this variability, but with more experience the energy system operators have become savvier.
One way to view the variable is to consider it as a reduction of load. The remainder represents our net energy resources. To the extent that wind differs from the forecast (load versus wind) the difference has to be taken up by our flexible units in generation reserve. Each balancing period is an hour; they may be shortened.
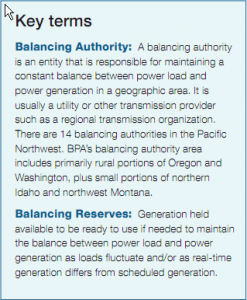
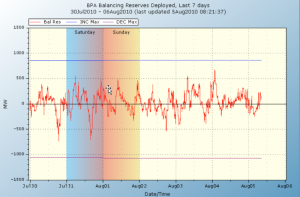 Review the reserves shown on the BPA site – 5 minute data on their system. It shows about 850 MW of reserve including that portion that can be decreased (“decs”) and that portion that can be increased (inc’s”).
– Chief among power system operators concerns– having sufficient capability to increase or decrease generation levels as the combination of wind and load vary.
– Larger impacts to balancing areas transmitting wind to meet demand outside their territory.
o For example, Montana has lots of wind but little balancing generation or native load.
The balance of Ken Dragoon’s presentation concerned it self with various actions that could be taken by the various balancing authorities to increase the efficiency of the gird, such as:
– Unifying trading practices to allow half-hour trading.
– Implementing automated within-hour trading.
– Sharing of imbalances across time and geography on sub-hourly timescales.
– Consideration of Balancing Area Consolidation.
 Ken then presented information from the National Renewable Energy Laboratory (NREL) that suggested that incremental improvements in the gird would likely permit us to reach the 20% threshold. He also cited the Irish study that suggested that even at 41% penetration of wind no storage was needed.
Finally he discussed the Danish model.
– Denmark uses “waste” energy from power plant cooling systems to heat 60% of all buildings in district heating systems.
– Large insulated hot water storage facilities decouple electric generation from building space and water heating needs.
– At times when wind generation exceeds load and export capability, power can be used to heat water in storage facilities.
How does this example of using water heaters translate into the Pacific Northwest?
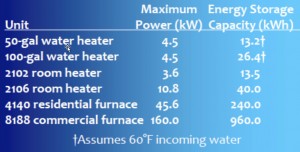
In the PNW we have more than a 2,000 MWa electric water heater load and a more than 4,000 MW of coincidental peak demand.
And how does this water heater capability compare with other storage technologies?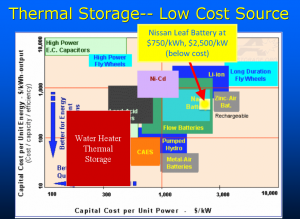
– Very low losses compared with most other technologies.
– Very low cycling costs and long lifetimes little affected by cycling.
– Cost mostly proportional to maximum energy storage– not as sensitive to power levels.
The NWPCC is looking to implement end-use control strategies in the Northwest:
o Electric Space Heat
o Commercial and Industrial Processes
o Municipal Water Pumping/Storage loads
We must change the paradigm so that demand is adjusted to meet supply. Henrik Bindslev, the Risø Director said it best. “The Danish power system will move from one where supply responds to demand, to one where demand responds to supply.”
_____________________________________
 Smart End-Use Energy Storage and Integration of Renewable Energy
Diane Broad, Principal Investigator/Recipient, Ecofys US, PE
Our final speaker of the evening was Diane Broad, who spoke about Ecofys’ projects to validate the energy storage concept using water heaters. Ecofys is a 300-person renewable energy company. Her focus is on how we generate power, how do we connect the grid, and how we make the grid more friendly to renewables.
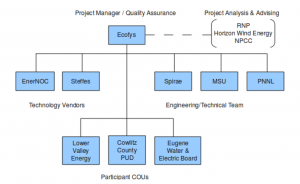 The purpose of the project was to facilitate the rapid development and deployment of end- use controllable loads, providing both balancing services in the BPA balancing area and localized benefits to BPA’s customer utilities.
The initial scope of the project was to develop 1MW to 3MW of demand response with energy storage, in the service territories of 3 Consumer-Owned Utilities (COUs): Lower Valley Energy, EWEB and Cowlitz Co. PUD.
The project intended to deploy Steffes Interactive Water Heater Controls on 50 and 105 gallon water heaters, and Steffes Electric Thermal Storage whole-house furnaces (Residential). Steffes is based in North Dakota where water storage makes a lot of sense because of high differentially energy prices between night and day. For the Commercial and Industrial segment of this project EcoFys has partnered with EnerNOC to deliver their DemandSMART solution into cold storage warehouses.
One of the key technologies that Ecofys tested was the technology’s ability to “Control & Dispatch”. Thus the water heaters had to be accessible to both increase and decrease loads in response to need for balancing in the BA, and for cost savings to the utility. They tested several control methods, control signals and dispatch options.
During the 12 – 18 month operation of pilot programs, Ecofys planed to develop both technical and economic optimizations; create a Guidebook for Utilities including a business case and technology overviews.
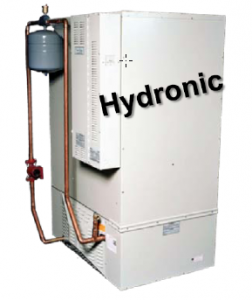
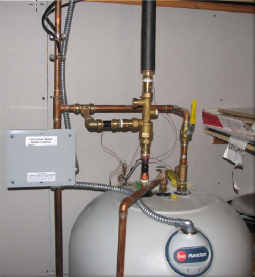 On the residential side the project will install a 105 gallon water heater with iWHC (a thermal battery) that heats water to 170° F . The unit includes a mixing valve for consumer safety. This will be used for effective use of water heating as DR resource. For space heating and cooling the project includes a ETS Furnace, Forced Air or Hydronic. This is equivalent to a 10x larger battery and coupling it with air-source heat pump increases the efficiency even more.
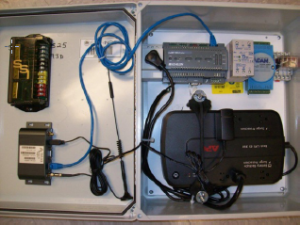
For the Commercial and industrial applications this project is using an EnerNOC Site Server (ESS), a gateway device that establishes communication with the network and provides near-real time visibility into end-user energy consumption. The ESS also allows the NOC to remotely control loads in order to deliver demand response capacity.
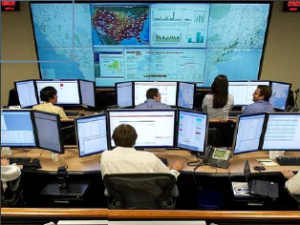
 EnerNOC’s two Network Operations Centers (NOCs) are staffed 24x7x365. They feature advanced technology and a specialized staff to ensure that load reductions happen quickly, efficiently, and consistently for both the utility and end users. Finally, EnerNOC web-based energy management platform, PowerTrak® monitors energy consumption and enables end-user load control. DemandSMART also provides end- users with a web portal, and utilities with the ability to view load increase or decrease during demand response events.
Diane talked about the progress of the project with its many partners and diverse hardware solutions. Needless to say the project was delayed in some aspects and is only now starting to make progress – now that all the partners are on board.
Expected benefits for the Consumer-Owned Utilities:
The benefits for Consumer-Owned Utilities (BPA served utilities) in the region include the ability to implement very flexible resources when they deploy controllable loads like those in this project. The benefits include:
– Cost savings by reducing peak demand charges
– Cost savings by changing the utilities’ load shape, shifting energy use towards or away from certain hours of the day
– Potential revenue from sale of balancing services
– Potential for delaying investments in distribution system (substations, lines) by implementing grid-responsive control modes.
The Benefits for the BPA?
The BPA is searching for new resources for balancing reserves in part due to the increased impact of the variability of wind energy on the BPA system, and looking at energy storage options. Apart from these benefits, controllable loads have value to the BPA for load shifting, short-term curtailments, and load shaping.
Benefits for the Renewable Energy Industry?
This project introduces new resources for providing balancing reserves possibly contracted directly from the COU’s as self-supply. It provides an Economic Stimulus/Job Creation benefit since the installation of new water and space heating equipment creates jobs in the trades. Wider-scale implementation could have spin-off effects and synergies with other Smart Grid initiatives.
BPA cost/revenue impact:
If this project can validate the effectiveness of using water heaters, hydronic systems and the EnerNoc energy management tools, the BPA would get a new resource for balancing reserves and energy storage at lower cost than some other alternatives.
When implemented on a larger scale than these pilots, the use of controllable loads with storage is expected to provide a resource on the lower end of the current market cost for reserves of $5 to $15 per kw- month. This project intends to clarify those costs. So far the Steffes ETS has been shown to cost 1⁄4 to 1⁄2 of competing energy storage technologies like pumped storage, CAES, batteries and flywheels.
DR is not just about curtailment but also about both increasing and decreasing load to help the grid operator. The Pacific NW has 82% electric water heaters which might be able to provide balancing services. This represents a significant opportunity for utilities to get cost savings by:
– Peak shaving
Shaping the load throughout the day; shifting load from hours where it usually occu
This will all tie into my discussion with the class about where smart grid investment stands in the regulated world. And what the potential avenues are for investment. I’ll be trying to get across that DR in not an overnight resource, that it is not equal to a generating resource, that smart grid is an enormous paradigm shift for regulators most of which still struggle with simple and sensible investment in energy efficiency. We’ll be looking at some recent decisions by PUCs in the PNW on recovery of EE investments and speculate what that means for smart grid investment.


